
Ticket Analytics
Ticket Analytics provides all details related to your tickets of negative reviews in the form of graphs and charts. You will see individual analytics for all, opened, and closed tickets separately.
Based on these insights, users can make improvements in the required area of their businesses and gain positive reviews.
To view ticket analytics, follow this step-by-step process:
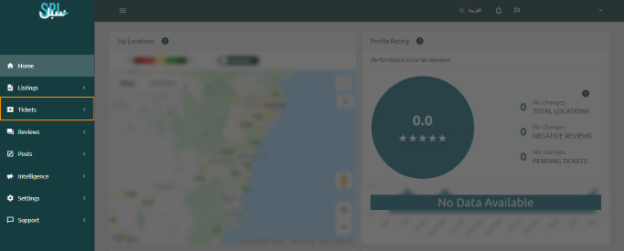
Step 1: Go to Listings in the left-side panel on your dashboard.
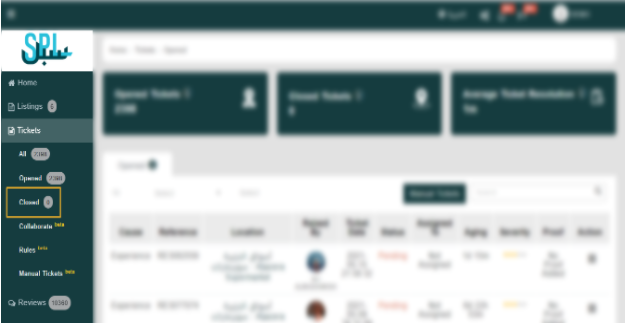
Step 2: Click on the Tickets “ALL”. On the following screen, you will see the list of all tickets:
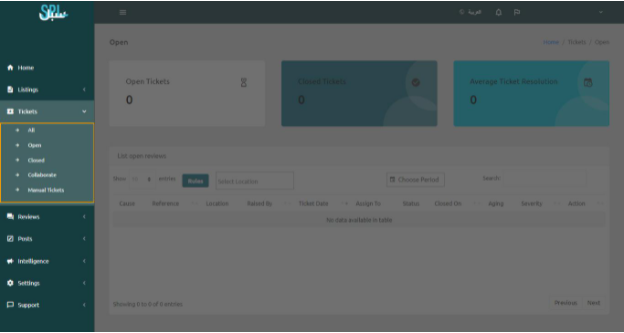
Step 3: Now, scroll down to the bottom to see analytics for all tickets.
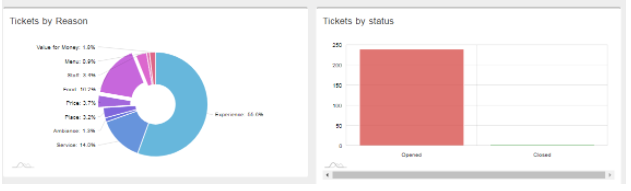
The chart on the left side shows the percentage of tickets by reason. The graph on the right side shows the tickets by status. For instance, in this graph, 200-250 tickets are opened while very few tickets are closed.
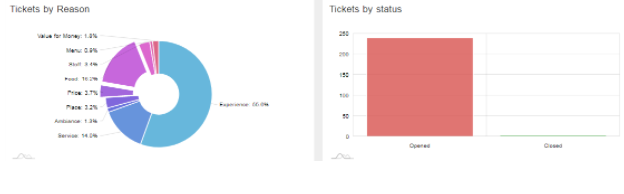
Step 4: To view Ticket Analytics only for opened tickets, Click on “Opened” under the side menu.

Step 5: Now, scroll down to see tickets analytics for opened tickets. These will be the same as that for all tickets.
Step 6: To view Ticket Analytics only for closed tickets, Click on “Closed” under the side menu.
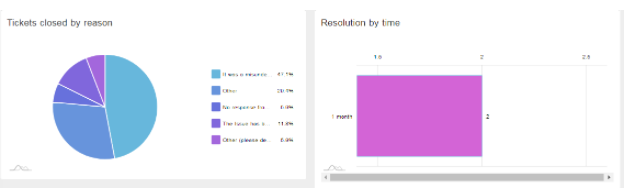
Step 7: Now, scroll down to see tickets analytics for closed tickets. You will see analytics for tickets closed by reason and resolution by time.
If you still have any questions or any doubts, you can contact us now.